Note
Click here to download the full example code
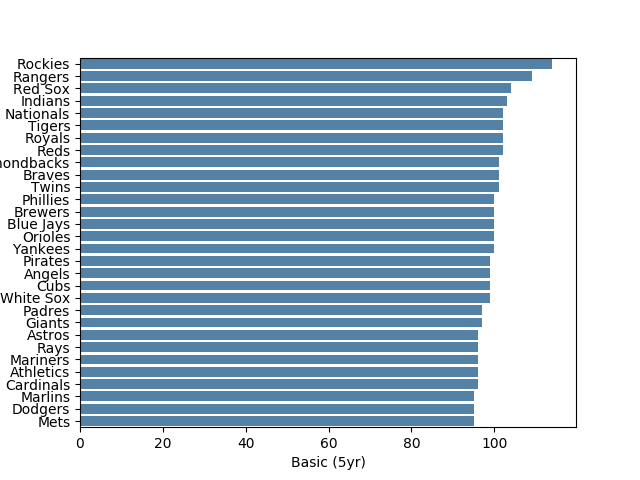
Fangraphs Park Factors
Out:
<matplotlib.axes._subplots.AxesSubplot object at 0x7f0c8eb1d650>
import seaborn as sns
from pybbda.data import FangraphsData

fg_data = FangraphsData()
pl_col = "Basic (5yr)"
sns.barplot(
    data=fg_data.fg_park_factors_2018.sort_values(pl_col, ascending=False),
    y="Team",
    x=pl_col,
    color="steelblue",
)
Total running time of the script: ( 0 minutes 0.633 seconds)